01 / AI · Data platform · SaaS
Market Regime Radar
An AI-first market terminal: two dozen signals, one clear call, explained with sources.
- Type
- In-house product
- Year
- 2026
- Services
- Custom software · AI integration · APIs & data pipelines · Accounts & billing
- Full-window screens
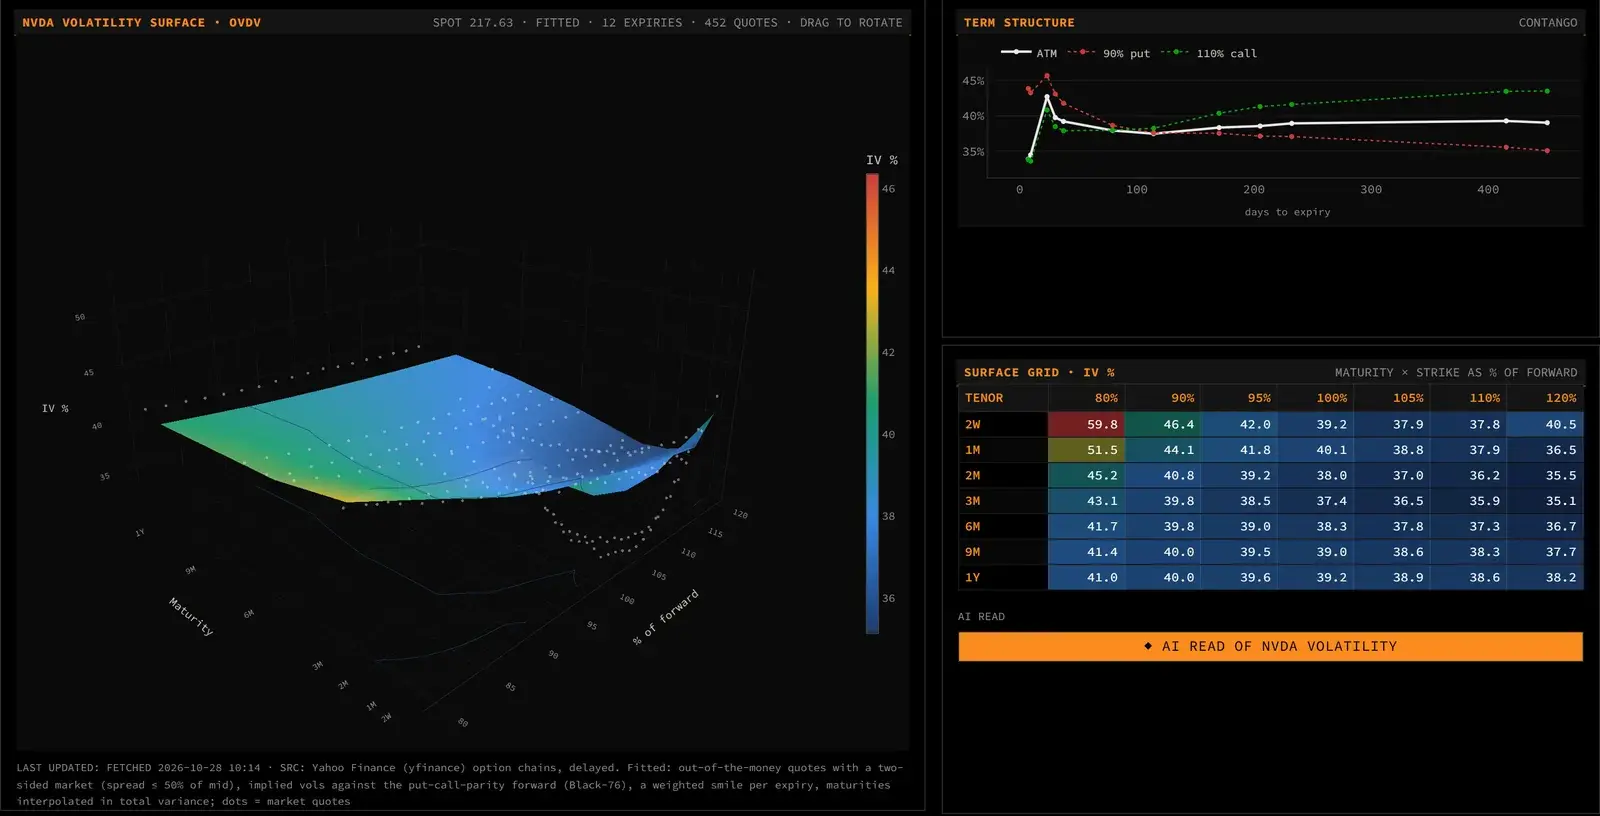
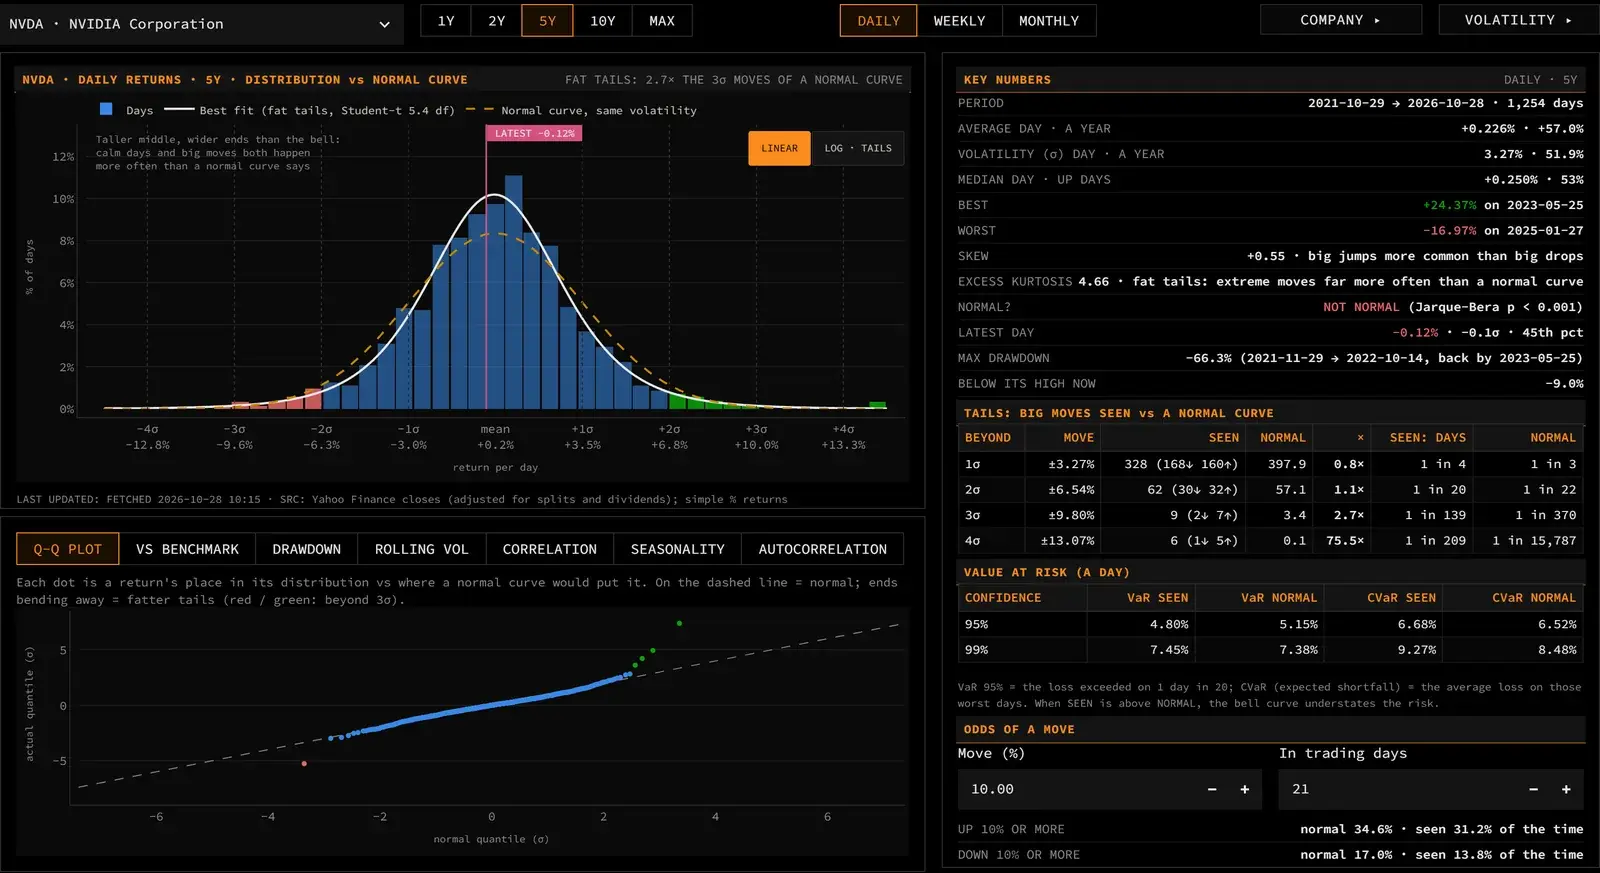
- 23
- Macro & market signals
- 24
- AI providers supported
- 3
- Interface languages
- EN·FR
The challenge
Reading the market means juggling dozens of sources (macro data, rates, credit, volatility, headlines) and turning them into one decision. Professional terminals are expensive, and they still leave the interpretation to you.
What we built
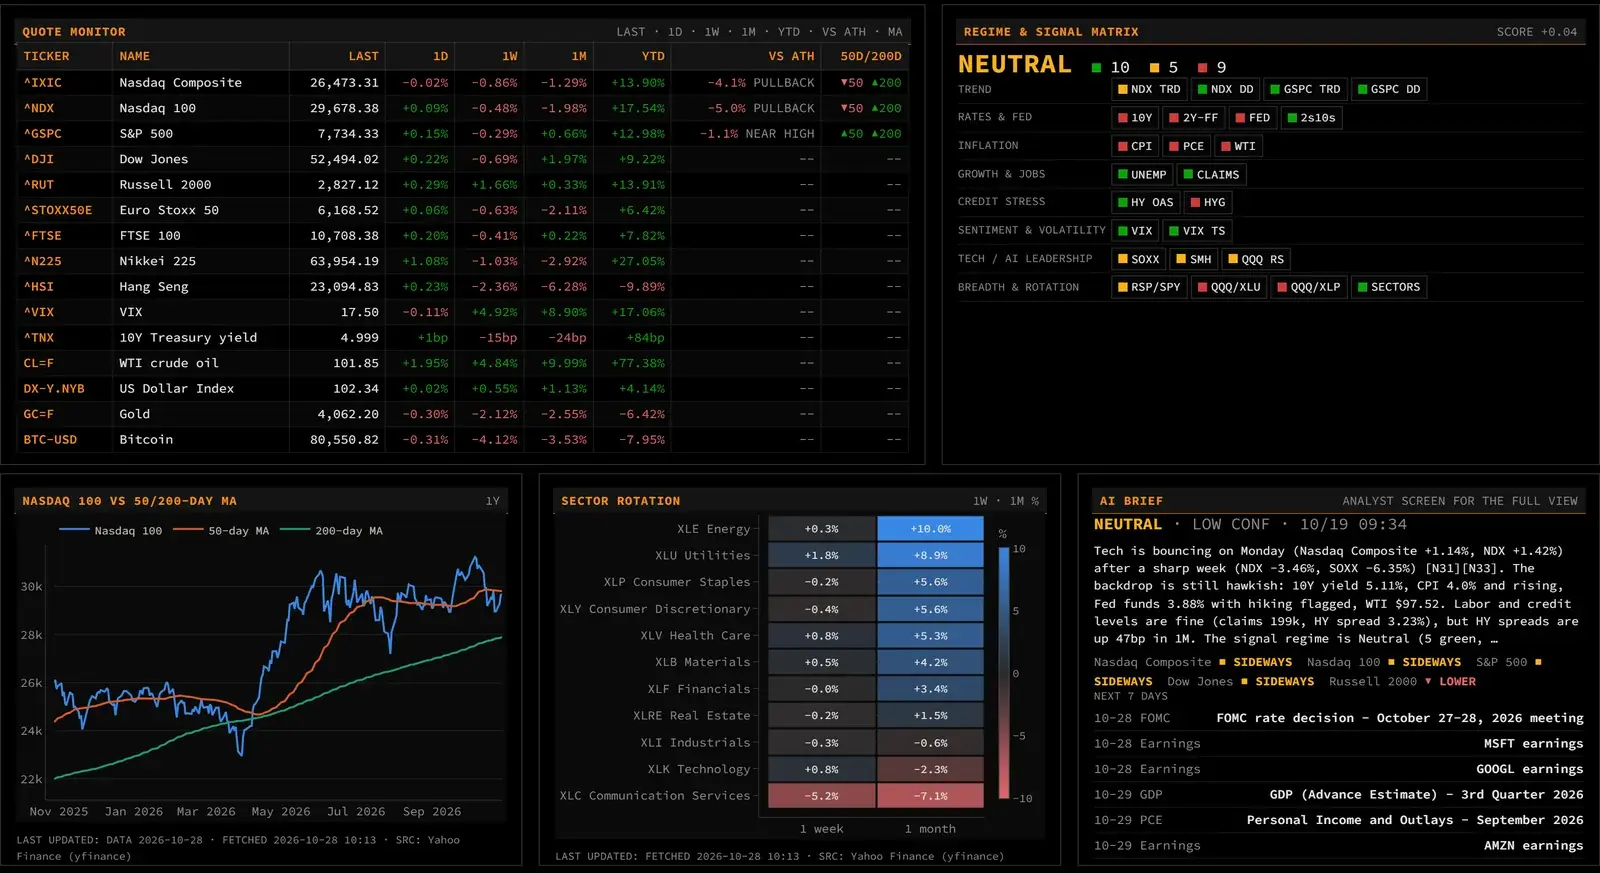
A Bloomberg-style terminal built around an AI analyst. It reads every screen, makes one call (risk-on, neutral or risk-off), explains why with cited sources and answers follow-up questions. Each user gets their own focus, layout, watchlists and plan.
- 01
An analyst, not a chatbot
The AI reads the same signals the user sees, commits to a regime call with a confidence level, cites the headlines behind it and stays available for follow-up questions.
- 02
Product-grade foundations
Google sign-in, per-user preferences, encrypted API keys, free and paid plans with Stripe trials, and a database layer with migrations.
- 03
Live data from many sources
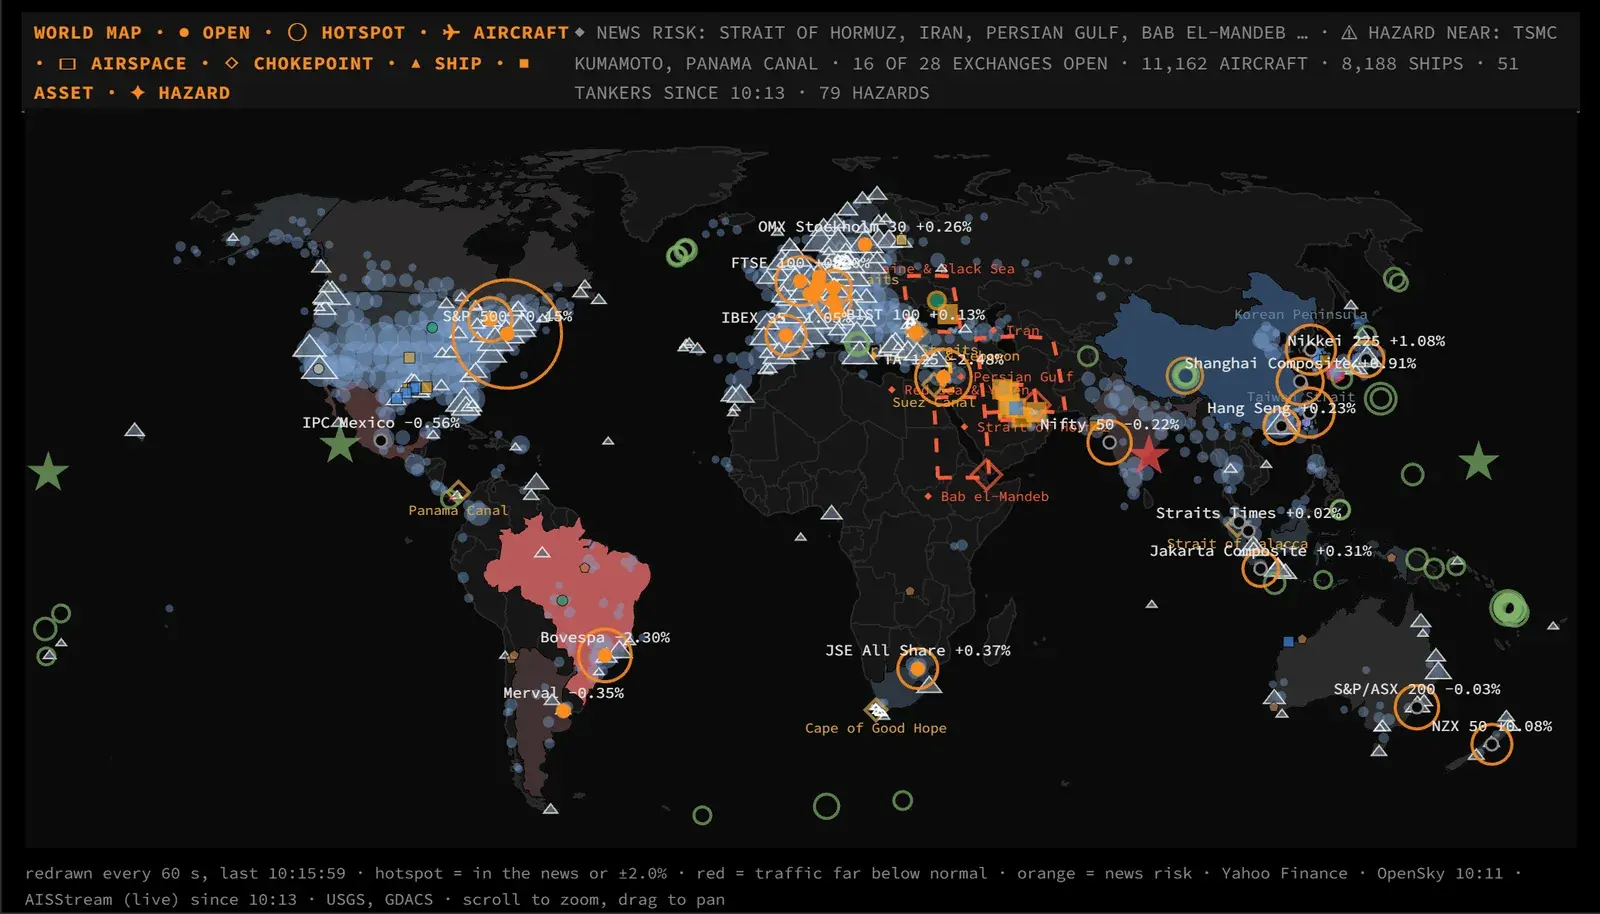
Market data, macro calendars, news and live global feeds (aircraft, shipping and natural hazards) merged into a single world view.
- 04
Architecture that stays clean
Six strict layers (core, market, AI, accounts, UI, screens) with a test that fails the build if a layer imports the wrong way.
Technology
- Python
- Streamlit
- Plotly
- PostgreSQL
- SQLAlchemy
- Claude API
- OpenAI
- Gemini
- Stripe
- Google Sign-In
Want something like this for your business?
Book a discovery call